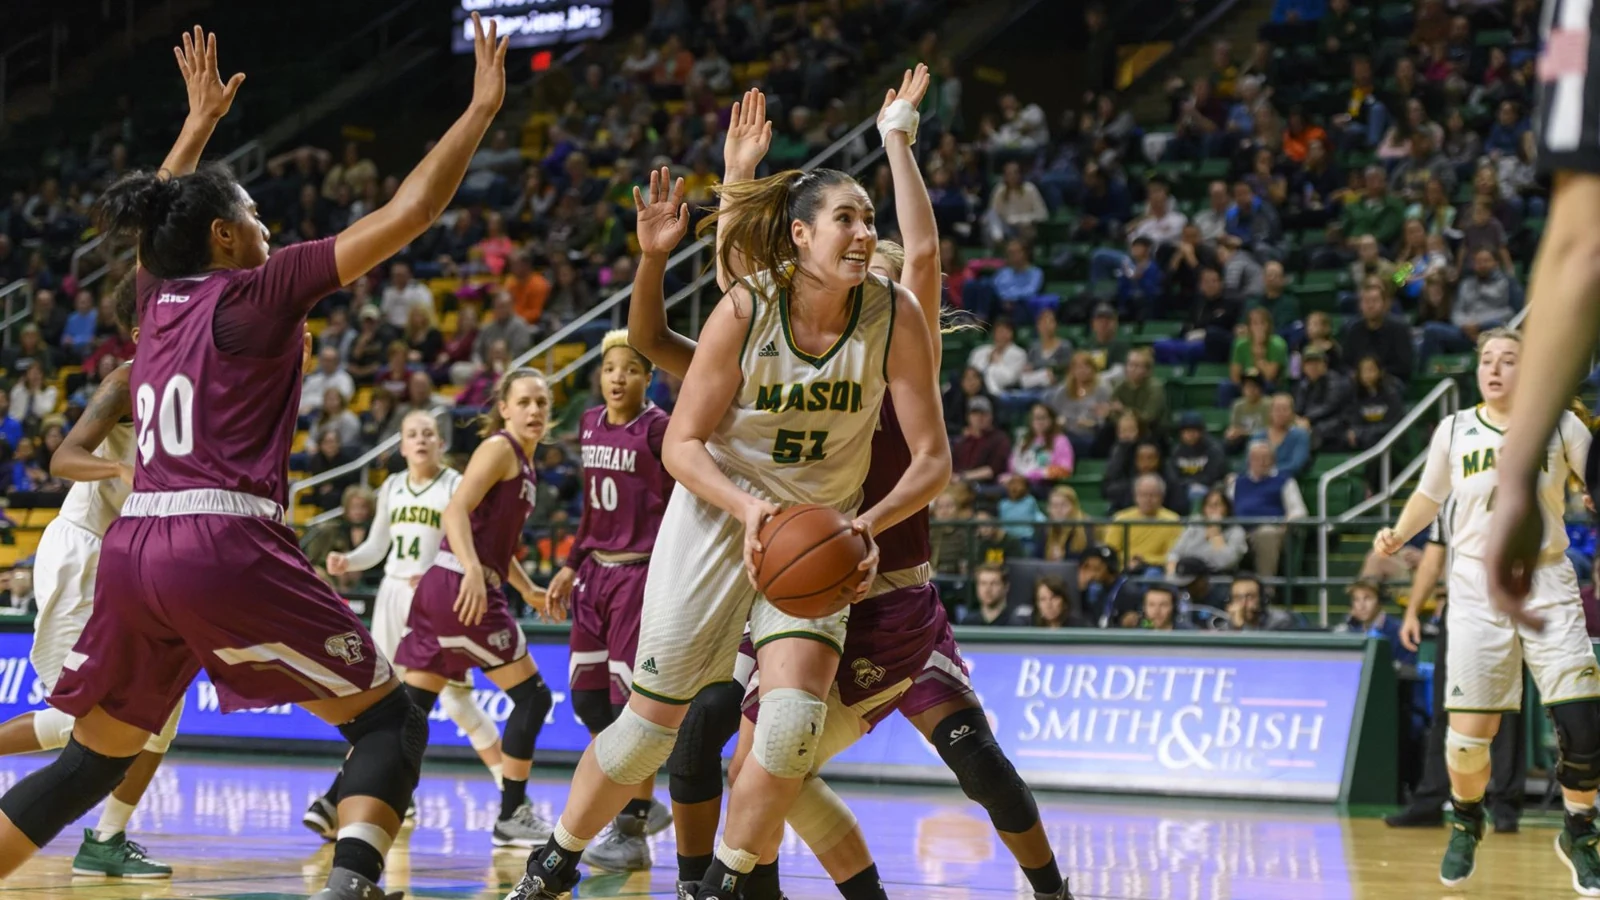
Cover photograph: Natalie Butler with George Mason against Fordham during the 2017-18 season. Archive credit: Rafael Suanes/George Mason Univ., via George Mason Athletics.
The best-known non-scoring NCAA women's basketball records include Courtney Paris's 2,034 career rebounds, Suzie McConnell's 1,307 career assists, Brittney Griner's 748 career blocks and UConn's 111-game winning streak. Each is a Division I benchmark, but the most revealing comparisons come from separating career totals, season totals, averages and the settings in which teams keep winning.
Reading the NCAA women's basketball record book
This guide was checked on September 9, 2026, using the currently downloadable NCAA record book together with later official school reports and game statistics. The downloadable book contains historical tables that are not uniformly updated through the 2026 season. The April 2026 streak ending discussed below comes from that game's official report, rather than treating the book's download date as its statistical cutoff.
The records in this guide are for NCAA Division I women's basketball. That qualification matters: a Division II career, a Division III winning streak and a Division I tournament performance belong to different comparisons. The NCAA's records directory separates those divisions and also provides an association-wide book. It lists championship records separately from the broader individual and team records.
The official statistical era also has boundaries. The Division I book's opening definitions begin official women's records in 1981-82, with assists added in 1985-86 and blocked shots in 1987-88. Those dates describe national recordkeeping, not the invention of passing or shot-blocking. An older player's absence from a modern table is not evidence that she lacked that skill.
Before comparing two numbers, finish the sentence describing each one. Is it the most rebounds in a career, the most in one season, or the highest average per game? A player can lead one category without leading the others. A season total rewards both production and the opportunity to keep playing; an average answers a different question about the rate of production. Neither automatically settles who was the better player.
The same care applies to the word “tournament.” A performance in March contributes to a player's season, but an NCAA tournament record has its own narrower field of eligible games. A conference tournament is another competition again. Keeping those labels attached allows a remarkable night to remain remarkable without promoting it into a record it did not break. The following sections pair the headline figures with the careers and games that make them meaningful.
Rebounding records reward different kinds of dominance
Rebounding offers the clearest example of why a record needs its full label. Courtney Paris owns the Division I career total; Natalie Butler owns the single-season total. Yet neither owns the highest average in the corresponding category. Their achievements remain extraordinary precisely because we can describe what each one measures.
Courtney Paris and the 2,000-rebound barrier
Paris finished her Oklahoma career with 2,034 rebounds in 137 games, or 14.8 per game, in the NCAA table. Oklahoma's career tribute adds a different measure of consistency: 112 consecutive double-doubles, spanning four seasons, and a senior-year trip to the 2009 Final Four. A career total that large was built through repeated nights of major production, not one short burst late in her senior season.
The previous record holder's school supplies a useful moment in the chase. Drake reported in February 2009 that Paris had passed Wanda Ford's 1,815 career rebounds. Paris collected eight boards against Oklahoma State in a 93-75 victory on February 8, bringing her total to 1,823. The milestone game did not require an outlandish individual rebounding line: years of accumulated work made an eight-rebound afternoon historic.
Ford still illustrates why losing one record does not erase another. The NCAA's rebounding categories list her career average at 15.5, from 1,815 rebounds in 117 games. Paris played 20 more games and finished with the larger total. One comparison asks who collected more across a career; the other asks who collected more per appearance. There is no contradiction to resolve.
Natalie Butler and the difference between totals and averages
Butler's 2017-18 George Mason season ended with 563 rebounds in 34 games. Her Mason season biography records 33 double-doubles and the Atlantic 10 Player of the Year award. Dividing 563 by 34 produces the familiar rounded average of 16.6. That was the country's leading average that season, but the historical single-season average record belongs to Rosina Pearson: 18.5 for Bethune-Cookman in 1985.
Butler passed the old season total during an actual postseason breakthrough. In Mason's 82-75 WNIT win over Stephen F. Austin on March 16, 2018, she produced 20 points and 22 rebounds. It was Mason's first postseason victory. Nicole Cardaño-Hillary scored 28 points, and her late-third-quarter three-pointer began a 17-0 run. The record mattered within a game that still required somebody to turn possessions into baskets.
That is a useful way to watch an elite rebounder. Separate the work of extending your own offense from ending the opponent's possession, then ask what happens with the ball afterward. A rebound creates or preserves an opportunity; its value to a particular result becomes clearer when you connect it to the next shot, transition chance or settled possession.
Assist records belong to more than one kind of playmaker
An assist credits a player for creating a made basket for somebody else. That makes the statistic inherently connected to teammates: a good pass and a missed shot do not produce the same entry in the box score as a good pass and a finish. The great career totals therefore describe sustained creation within an offense, not a collection of spectacular passes detached from team basketball.
Suzie McConnell set the career standard at Penn State
Suzie McConnell's 1,307 career assists remain the Division I benchmark in the official book. Penn State's Hall of Fame tribute describes 71 games with double-digit assists and her distinction as the program's first first-team All-American. Reaching ten assists was not an occasional headline in her college career; it was a recurring part of Penn State's offense.
The team record provides additional context. A later Penn State career account records a 95-33 mark and four NCAA tournament appearances during her four varsity seasons. The passing production accompanied a team that repeatedly reached the national tournament. That does not mean each win can be assigned to one guard, but it places the career in a competitive setting instead of leaving 1,307 as an isolated number.
McConnell also retains a separate season-rate landmark: 355 assists in 30 games in 1986-87, rounded to 11.8 per game. A reader finding an older article that calls those 355 assists the season-total record has found an accurate statement from an earlier moment. The total was subsequently surpassed. The average and career total tell their own continuing stories.
Courtney Vandersloot turned a record season into a tournament run
Courtney Vandersloot finished Gonzaga's 2010-11 season with 367 assists. Gonzaga's postseason account links that record year to a 31-5 finish and the program's first Elite Eight. She ended her career with 2,073 points and 1,118 assists, becoming the first Division I player, woman or man, to pass both 2,000 points and 1,000 assists. Opponents had to account for a scorer as well as a distributor.
Her Sweet 16 box score against Louisville makes that combination concrete. In a 76-69 win on March 26, 2011, she scored 29 points on 8-of-10 shooting and made 12 of 14 free throws. She also had seven assists, seven steals and seven turnovers. A game from a historic passing season could demand exceptional scoring and still include costly mistakes with the ball.
The lesson is to read across the row. Assist totals describe successful creation; turnovers show possessions lost; shooting and free throws reveal another way a guard can put pressure on a defense. Vandersloot's seven assists against Louisville matter more when placed beside the rest of that performance than when compared mechanically with her season average.
Shot-blocking records need both volume and context
Shot-blocking creates an obvious highlight, but the historical comparison is subtler than the height of the rejection. Brittney Griner's career total and Louella Tomlinson's career average describe different forms of sustained rim protection. Their college careers also show how a defensive specialty can coexist with a much broader workload.
Brittney Griner combined rim protection with championship success
Griner recorded 748 blocks in 148 Baylor games. Her completed Baylor biography also identifies her extraordinary freshman season: 223 blocks in 2009-10. That total, achieved in 35 games, is the NCAA's Division I single-season record. The rounded average of 6.4 blocks per game is the season-rate record as well.
Her national championship came later, in 2012. In Baylor's 80-61 title-game victory over Notre Dame, Griner had 26 points, 13 rebounds and five blocks as the Bears completed a 40-0 season. The five rejections were part of a performance that also required her to score and rebound. Her most prolific blocking season and her championship season were different years.
That distinction is useful when evaluating a modern defensive star. More blocks do not automatically produce a better team result, and a lower total does not prove that an interior defender has become less effective. A possession can end in a missed shot without a recorded block. Conversely, a spectacular rejection can leave the offense with another attempt if the ball returns to an opponent.
Louella Tomlinson and the career-average benchmark
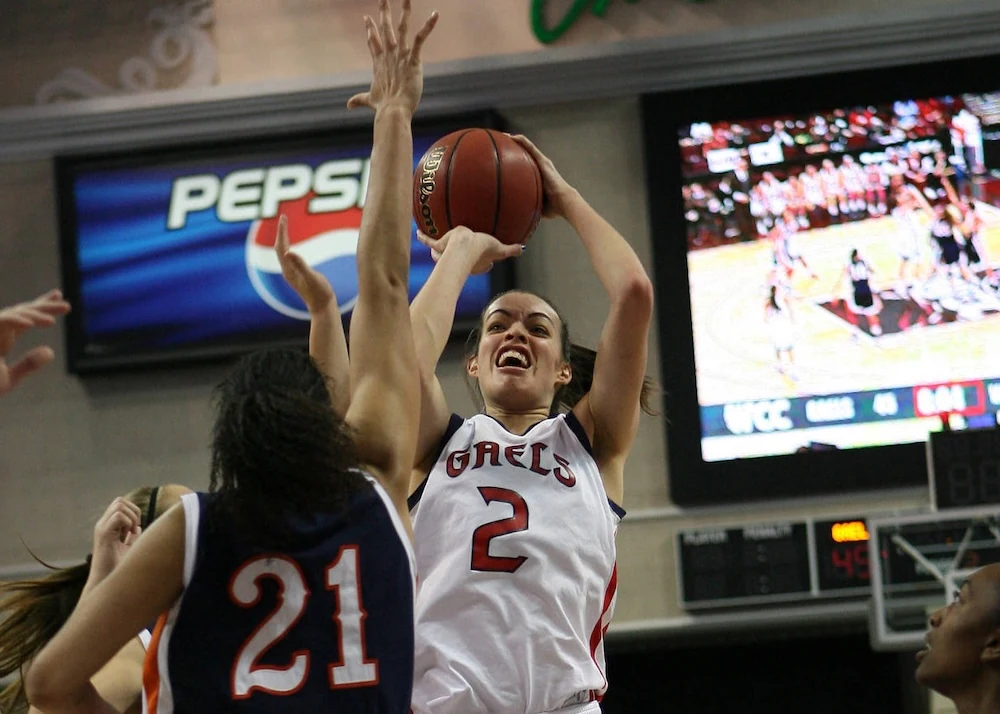
Tomlinson's record is 5.30 blocks per game across her college career, based on 663 blocks in 125 games. A Saint Mary's jersey-retirement tribute in 2026 confirms both the rate record and her position behind Griner in total blocks. She also earned two West Coast Conference Defensive Player of the Year awards. Griner accumulated more rejections; Tomlinson accumulated them at the higher rate per appearance.
A February 2010 Saint Mary's report shows the demands surrounding that specialty. In a 56-46 victory over San Francisco, Tomlinson had 18 points, 24 rebounds and seven blocks. Against Santa Clara in the same week, she contributed 16 points, 14 rebounds and five blocks in a 69-62 win. These were substantial scoring and rebounding responsibilities alongside the rejections.
For a fan following a current shot-blocker, the next question is where the defensive possession ends. Does the team secure the loose ball? Does a teammate complete the rebound? Can the center stay involved without surrendering an easy finish elsewhere? Those questions do not replace the official record. They explain why the record's most memorable players often influence a game in ways that a single statistical column cannot capture.
Winning streaks change meaning when the setting changes
A winning streak sounds simpler than an individual statistical record: win the next game and add one. The complication is which games belong in the sequence. An overall streak includes every result within its stated scope. A home streak considers home games. A defeat at a neutral-site Final Four ends the first sequence while leaving the second untouched.
UConn won 111 straight before an overtime ending
The Division I women's overall benchmark is UConn's 111 consecutive victories from 2014 to 2017. The run ended in Dallas on March 31, 2017, when Mississippi State won 66-64 in a national semifinal. UConn's game report records Morgan William's winning jumper at the overtime buzzer and identifies the Huskies' previous defeat as an overtime loss to Stanford on November 17, 2014.
The ending also supplies a striking link to the block records discussed above. With regulation tied at 60, Gabby Williams blocked William's attempt to win the game, forcing overtime. William then made the deciding shot in the extra period. One defensive play preserved the streak for a few more minutes; one later offensive play ended it. Neither moment can be understood merely by reading the final margin.
A long streak magnifies the importance of a single result because every earlier win depends on avoiding the next loss. That is different from a career total, where a quiet night adds little but does not reset the accumulated number. The 111 victories remain a completed achievement. Mississippi State's win fixed the endpoint; it did not make the preceding run less real.
Home streaks and the 2026 postseason belong in separate columns
The NCAA's home-court table lists a different UConn record: 99 consecutive home victories from 2006-07 through 2011-12. Another Huskies home streak reached 98 before Baylor won 74-58 at the XL Center in Hartford on January 9, 2020. Those are two separate runs, with different dates and endpoints.
Baylor's account of the 2020 victory describes a decisive 15-0 run in the fourth quarter. This was not the game that ended the 111-game overall streak three years earlier. The two headlines can coexist because the 2017 semifinal was played at a neutral site, outside the set of games used to count home victories.
More recently, South Carolina ended a 54-game UConn winning streak with a 62-48 national semifinal victory in Phoenix on April 3, 2026. The school report confirms the endpoint; the official box score shows UConn shooting 19 of 61 and South Carolina making 18 free throws to UConn's four. The Gamecocks also led the rebound count 47-32.
Those figures describe how the last game differed from the victories that preceded it. They also prevent a stale headline from becoming a false current claim: the 54-game streak was over by September 2026. When the next run attracts attention, its start date, category and latest completed result belong beside the win count.
How to follow a record chase without losing the game
A useful record watch begins with a complete description: the player or team, the category, the division and the number needed to pass the mark. Keep the current total separate from a projected finish. A projection can help explain the size of a challenge, but it cannot tell you how many postseason games a team will earn or how much a player's role will change.
Consider a hypothetical rebounder with 1,800 career boards and ten games remaining. Passing Paris's 2,034 would require 235 more rebounds, or 23.5 per game over those ten appearances. That calculation is a statement about the required pace, not a prediction that the player will reach it. If the team earns additional postseason games, the required average changes. If it is eliminated earlier, the available opportunities shrink.
Season-average chases need the opposite kind of attention. Another game can increase a total while lowering an average, because the denominator grows as well. Use the underlying totals and appearances when the comparison is close. A one-decimal display is convenient for reading a leaderboard, but it does not always show enough precision to establish who is actually ahead.
For the next college season, use the women's college basketball calendar to locate games and the scores page to follow results. The NCAA's statistics directory provides the separate season and historical comparisons. A milestone becomes more interesting when you can explain both what changed in the record book and what the player or team accomplished that night.
Join the conversation
Share a question or a thought about the women's game. Comments are reviewed before they appear. Keep it friendly, stay on topic and leave out personal information.
No comments yet. Start the conversation.
Sign in with Google to leave a comment. Your email address is not displayed with your comment.