Strength of schedule measures the opposition, not the team's record
Strength of schedule, usually shortened to SOS, describes how difficult a team's opposition has been under a specified ranking method. It helps explain the context around a win-loss record. It does not, by itself, tell you how well the team performed against those opponents or whether it deserves an NCAA tournament invitation.
That separation is the useful starting point for women's college basketball. Consider a purely illustrative comparison: two teams each have 20 victories, but one played substantially stronger opposition. The records contain the same number of wins; the opportunities and obstacles behind those wins differ. SOS helps identify that difference. A complete evaluation still needs the actual results, including which difficult games the team won and where its losses occurred.
The NCAA's 2026 women's selection principles identify schedule strength among the information used to evaluate teams. Its presence alongside other resources is significant. The committee needs context for a record, but context does not replace the record. Playing strong opponents creates a demanding test; successfully completing those tests is another question.
In the tables discussed here, No. 1 identifies the hardest schedule within the named measure. That ordering should not be confused with a team-quality ranking, where No. 1 identifies the strongest evaluated team. A school can lead an SOS table without being the country's best team. It can also be excellent while appearing much lower in overall schedule difficulty.
Rank numbers are ordinal. A schedule ranked 10th is ahead of one ranked 20th in that ordering, but it is not thereby “twice as hard.” Without a comparable underlying score and a defined scale, the size of the numerical gap cannot establish the size of the basketball difference. That is why a useful comparison looks beyond the rank to the opposition and the method used.
Always attach three labels to an SOS statement: the season, the source or method, and the observation date. “2026” on a college basketball statistics page commonly refers to the season ending in 2026, which is 2025-26. It does not automatically describe the new 2026-27 schedule. The historical examples below preserve that distinction rather than presenting last season's rankings as a fresh preseason forecast.
Location can matter to measures of schedule difficulty and to evaluating individual results, too. An opponent at home and the same opponent away do not create identical conditions. Before comparing two displayed values, establish whether the method accounts for that difference and whether both figures cover the same set of games.
Why different SOS tables produce different answers
There is no useful SOS comparison without knowing what sits behind the label. A publisher may display a NET-related schedule ranking, an RPI-based schedule score or a difficulty measure built from another set of team ratings. Those products can disagree while each is correctly reporting its own method. The first task is identification, rather than choosing whichever rank best supports a preferred team.
NET-based difficulty is different from a team's NET rank
The NCAA Evaluation Tool evaluates teams. Its two central components are Team Value Index and adjusted net efficiency, as described in the NCAA's explanation of NET. A schedule-strength column instead describes the opposition surrounding the team's results. The presence of NET in a table's title does not make those two columns interchangeable.
A concrete reading mistake is to see a team first in SOS and call it first in NET. The statements answer different questions: the former concerns difficulty, the latter the evaluated team. Similarly, subtracting the SOS rank from the NET rank does not produce a valid “overachievement score.” Both are orderings, not points on a common performance scale. Their difference has no automatically defined basketball unit.
The 2026 women's NET Nitty Gritty table displays the fields separately. That layout is a practical safeguard: read the column heading before interpreting a number. It also provides a route to the team's actual record, which is needed to assess what the team did with its schedule.
RPI-based and rating-based SOS need their own labels
RPI is an older evaluation framework involving winning percentage, opponents' winning percentage and opponents' opponents' winning percentage. A publisher can continue to calculate an RPI-based schedule measure even though women's Division I selection uses NET as its primary sorting tool. WarrenNolan maintains a separate RPI SOS page, with opponent-record information. That page should be cited under its own label.
A difficulty rating built from another team's power estimate can emphasize a different aspect of opposition from a win-percentage-based approach. Before transferring a conclusion between them, read the publisher's explanation. Do not assume that every site uses the same weights, includes future games or treats location identically. A shared abbreviation is not evidence of a shared calculation.
The men's and women's distinction is equally important. Some search results for “college basketball SOS” default to men's basketball. The NCAA explicitly uses distinct men's and women's NET models. A men's schedule table does not become evidence about a women's team merely because both programs share the same university name.
When two numbers differ, check those basic fields first: sport, season, method, observation date and game coverage. If they match and the values still conflict, then a source-specific discrepancy is worth investigating. If they do not match, the apparent contradiction may simply be two different questions being answered.
A dated 2025-26 example: overall versus nonconference difficulty
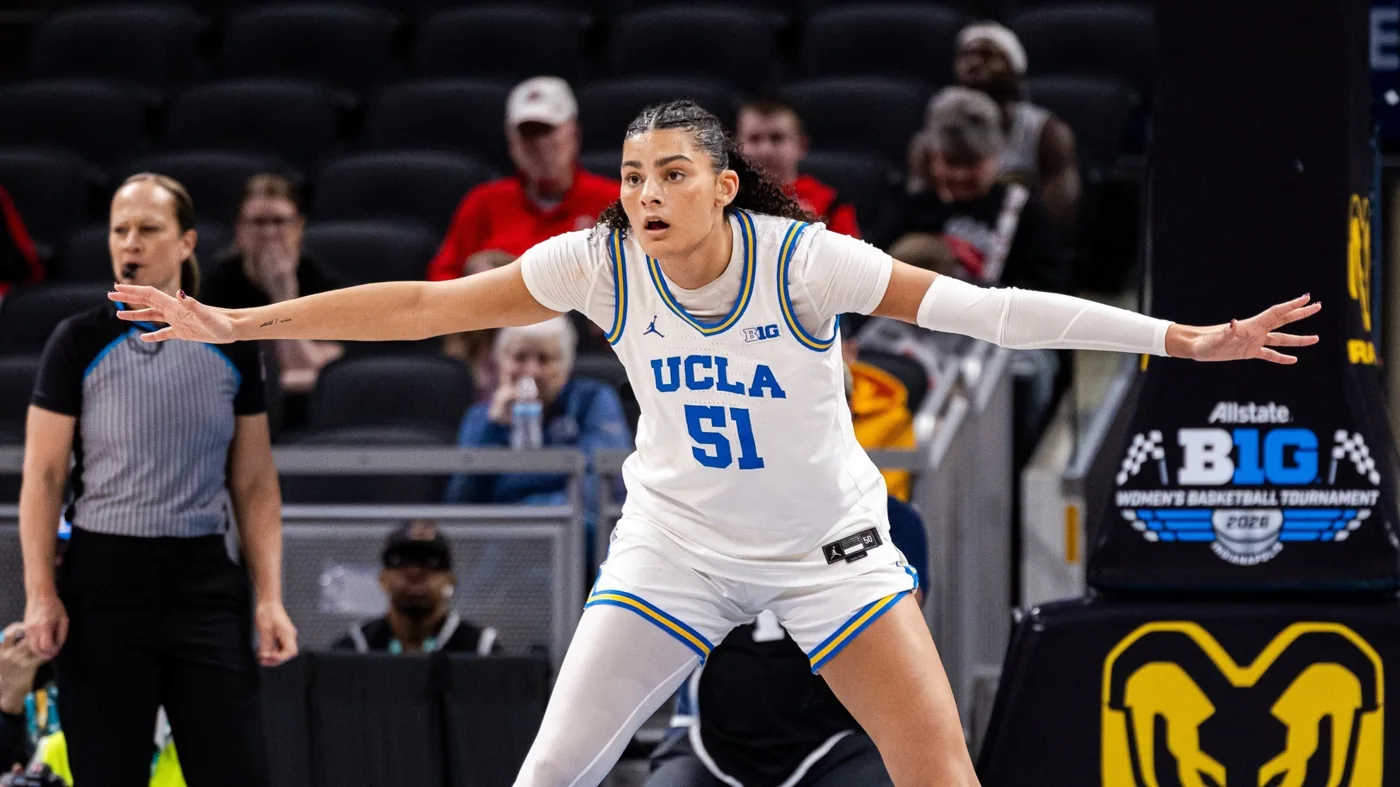
WarrenNolan's women's 2026 NET SOS table, read on October 20, 2026, provides a useful historical example. Its season-ending year identifies 2025-26. The table places UCLA, USC, Iowa, Tennessee and Texas in the first five overall SOS positions, while assigning each a different nonconference rank. These are the publisher's displayed rankings, rather than a new official 2026-27 national order.
| Team | Overall SOS rank | Nonconference SOS rank |
|---|---|---|
| UCLA | 1 | 12 |
| USC | 2 | 20 |
| Iowa | 3 | 40 |
| Tennessee | 4 | 21 |
| Texas | 5 | 32 |
| UConn | 58 | 1 |
The source is the 2026 women's NET SOS page. Its companion NET summary also displays the separate columns. Because both belong to the same publisher, their agreement is a consistency check, not independent proof of a universally accepted formula.
The contrast among those rows is the point. UCLA's overall No. 1 did not require its nonconference schedule to be No. 1. Iowa's overall third and nonconference 40th describe different sets of opposition within the season. A team can move substantially between the two orderings without either column being wrong. The complete schedule contains a different mixture from its nonconference subset.
UConn shows why the two columns cannot be interchanged
UConn's row makes the distinction especially clear: first in nonconference SOS, 58th overall in that table. A claim that UConn had the hardest overall schedule would misread the first number; a claim that it played an easy nonconference slate would ignore the other one. Both errors can arise when someone copies a rank without its heading.
Nor can those ranks be subtracted to derive UConn's conference-only difficulty. Fifty-eight minus one is arithmetic on two positions in different orderings. It is not a conference SOS score, and it does not tell us how much any individual opponent contributed. Answering that more detailed question requires the underlying method and game-level information.
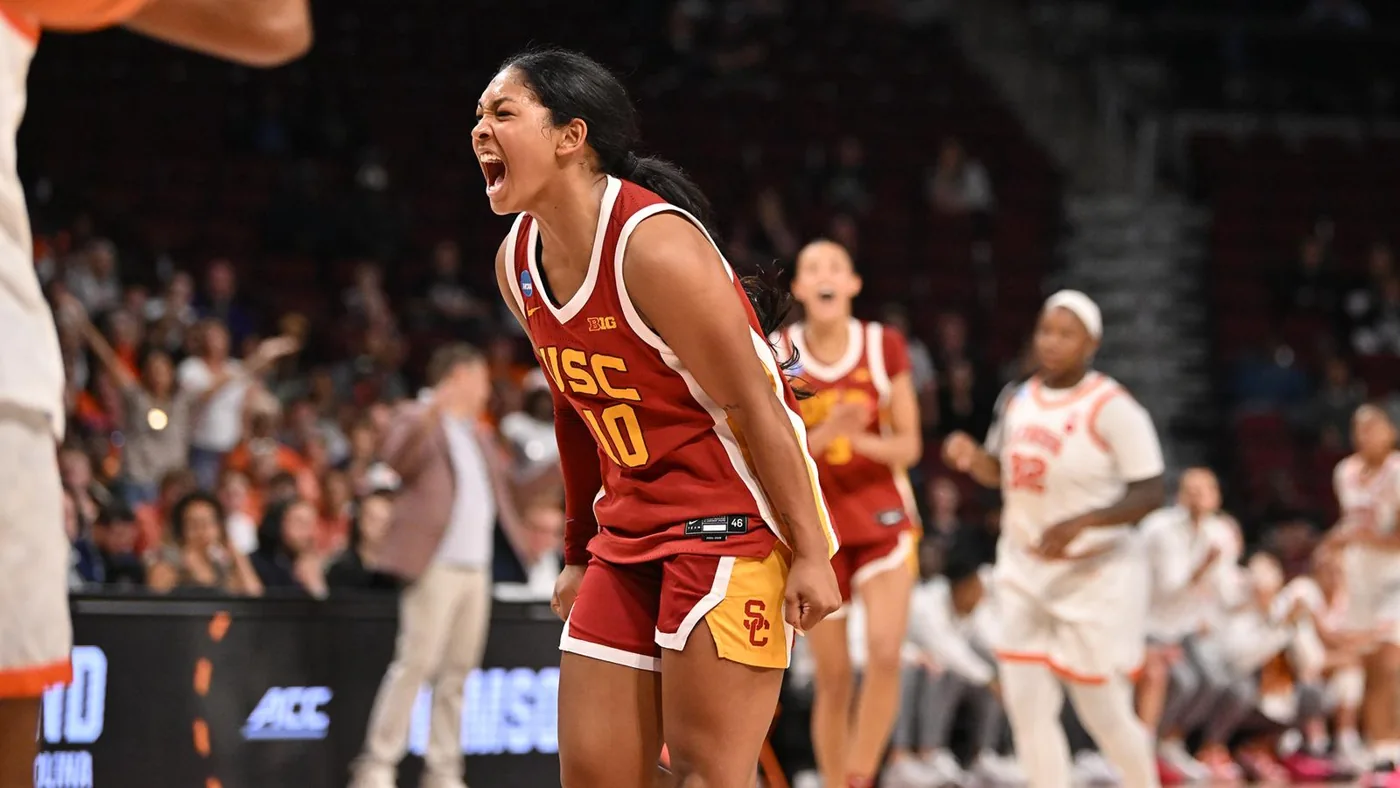
The publisher's UConn schedule archive puts actual opponents behind the distinction. Its nonconference regular-season games included Louisville on November 4, Ohio State on November 16, Michigan on November 21 and USC on December 13. In the archived opponent columns, their NET ranks are 11, 15, 6 and 22 respectively. The broader schedule also includes Big East games against Xavier on November 30 and DePaul on December 7, whose displayed NET ranks are 199 and 201. These are selected examples using the archive's eventual ranks, rather than rankings known before those games. They show that adding conference play changes the collection of opponents being measured. They do not independently reproduce the SOS formula, quantify each school's contribution or describe every Big East opponent.
Finally, this is an archive read after the season ended. The page's word “current” belongs to the selected 2026 season view. It should not be silently treated as the exact snapshot available on Selection Sunday, nor as a forecast for October 2026 rosters. Those are different dates and, in the latter case, a different season.
How schedule strength fits an NCAA tournament resume
A difficult schedule creates opportunities to demonstrate quality. The results determine what a team did with those opportunities. That is why an SOS rank cannot independently settle a tournament debate. A team with several wins over strong opponents presents different evidence from a team that lost every comparable test, even if their schedule-strength numbers are similar.
The 2026 women's NCAA selection principles list SOS alongside such considerations as significant wins, bad losses, head-to-head outcomes, overall record and NET. The list is a set of evaluation resources, not a formula that turns one rank into a guaranteed seed. Reading only the schedule column leaves out much of the evidence the process is designed to consider.
The same document introduced Wins Above Bubble into the women's criteria for 2025-26. WAB compares a team's wins with what a bubble-level team would be expected to achieve against the same schedule. That is a results-based question, distinct from asking how difficult the schedule was. A hard schedule and a strong record relative to a benchmark are related concepts, but they are not identical measures.
For a fan reading a team sheet, the sequence is therefore straightforward. Identify the overall record. Find the meaningful wins and damaging losses. Check location and opponent quality. Then use SOS to understand the difficulty of the wider slate. If the discussion involves an at-large comparison, a schedule column is one part of the argument rather than a substitute for identifying the best actual results.
Home and away context adds another layer. The NCAA's women's quadrant definitions differ from the men's, and individual games within the same quadrant need not be equally difficult. A large number of high-quality opportunities can be impressive, but the particular opponents and results still matter. Importing a men's cutoff or treating every game in a category as equivalent makes the comparison less accurate.
Timing matters when revisiting a past selection decision. The committee could evaluate the games and information available before its bracket was selected. An end-of-tournament archive can reflect additional opponents and results that had not yet happened. Using that later page as though it were a frozen Selection Sunday team sheet introduces hindsight into an argument about what the committee knew then.
That does not make historical rankings useless. It means the claim must match the snapshot. “This was the published end-of-season difficulty ordering” and “this was the evidence available during selection” are different historical statements. Preserving the date lets the numbers explain a season without asking them to prove a decision made under a different set of available results.
Read 2026-27 schedules as projections until results accumulate
As of October 20, 2026, a published 2026-27 schedule identifies planned opponents and locations. It cannot yet establish the complete difficulty those opponents will demonstrate during the new season. A preseason SOS forecast may still be useful, but it needs to be labeled as a projection and tied to the ratings or assumptions used to build it.
USC's announced 2026-27 slate, for example, includes South Carolina, Baylor and two regular-season games against UCLA. Those are concrete matchups worth marking on a calendar. Their presence supports a discussion of notable tests; it does not independently prove USC has the nation's hardest schedule under a particular future model.
The NCAA explains that NET does not import prior-season results or preseason rankings as inputs. That matters in October: last season's opponent order cannot simply be treated as the new season's official NET evidence. Returning players, departures and new roles may inform an editorial preview, but those judgments remain distinct from a ranking built from the current season's games.
Use a consistent checklist when comparing two teams
First confirm that both entries refer to women's Division I basketball and the same season. Next confirm the measure: NET-related SOS, RPI SOS or another named rating. Then check whether the figures cover completed games, the whole announced schedule or a projection. Only after those fields match should the ranks be compared.
Choose the same scope as well. Overall SOS and nonconference SOS answer different questions, as the UConn example demonstrates. Inspect the home, road and neutral-site distribution rather than relying on the biggest opponent name. Finally, read the results alongside the difficulty. That last step turns a schedule comparison into a discussion of what the teams actually accomplished.
Keep the check date with the conclusion. An opponent's evaluation can change as it plays more games, which can change the context of a result already recorded. That does not mean the original game changed; it means the evidence about the opposition became fuller. A responsible comparison is allowed to develop with the season.
The site's women's NET rankings explainer covers the team-evaluation side in greater detail. SOS adds a separate lens: the difficulty of the road a team traveled. Read together with the record, the particular wins and the date, it helps explain why two superficially similar seasons can present very different tournament cases.
For a 2026 historical query, use the explicitly labeled 2025-26 archive. For a 2026-27 preview, use confirmed new-season opponents and identify any prediction as such. For an in-season comparison, return to a consistent current table after results accumulate. Those three uses preserve the value of schedule strength while keeping the numbers attached to the question they can actually answer.
Join the conversation
Share a question or a thought about the women's game. Comments are reviewed before they appear. Keep it friendly, stay on topic and leave out personal information.
No comments yet. Start the conversation.
Sign in with Google to leave a comment. Your email address is not displayed with your comment.